9.1 Read the Dashboard
The Dashboard opens when you sign in. The cards at the top give you the state of your network at a glance.
| Card | What it tells you |
|---|
| Total Screens | How many screens are in your network. |
| Active Licenses | How many licenses are in use. |
| Online Screens | How many screens are connected right now. |
| Average Uptime | How consistently your screens stay online. |
| Campaign Health | How your running campaigns are doing. |
| Failed Devices/Alerts | Devices or events that need attention. |
| Pending Publish Jobs | Publishing that has not yet reached screens. |
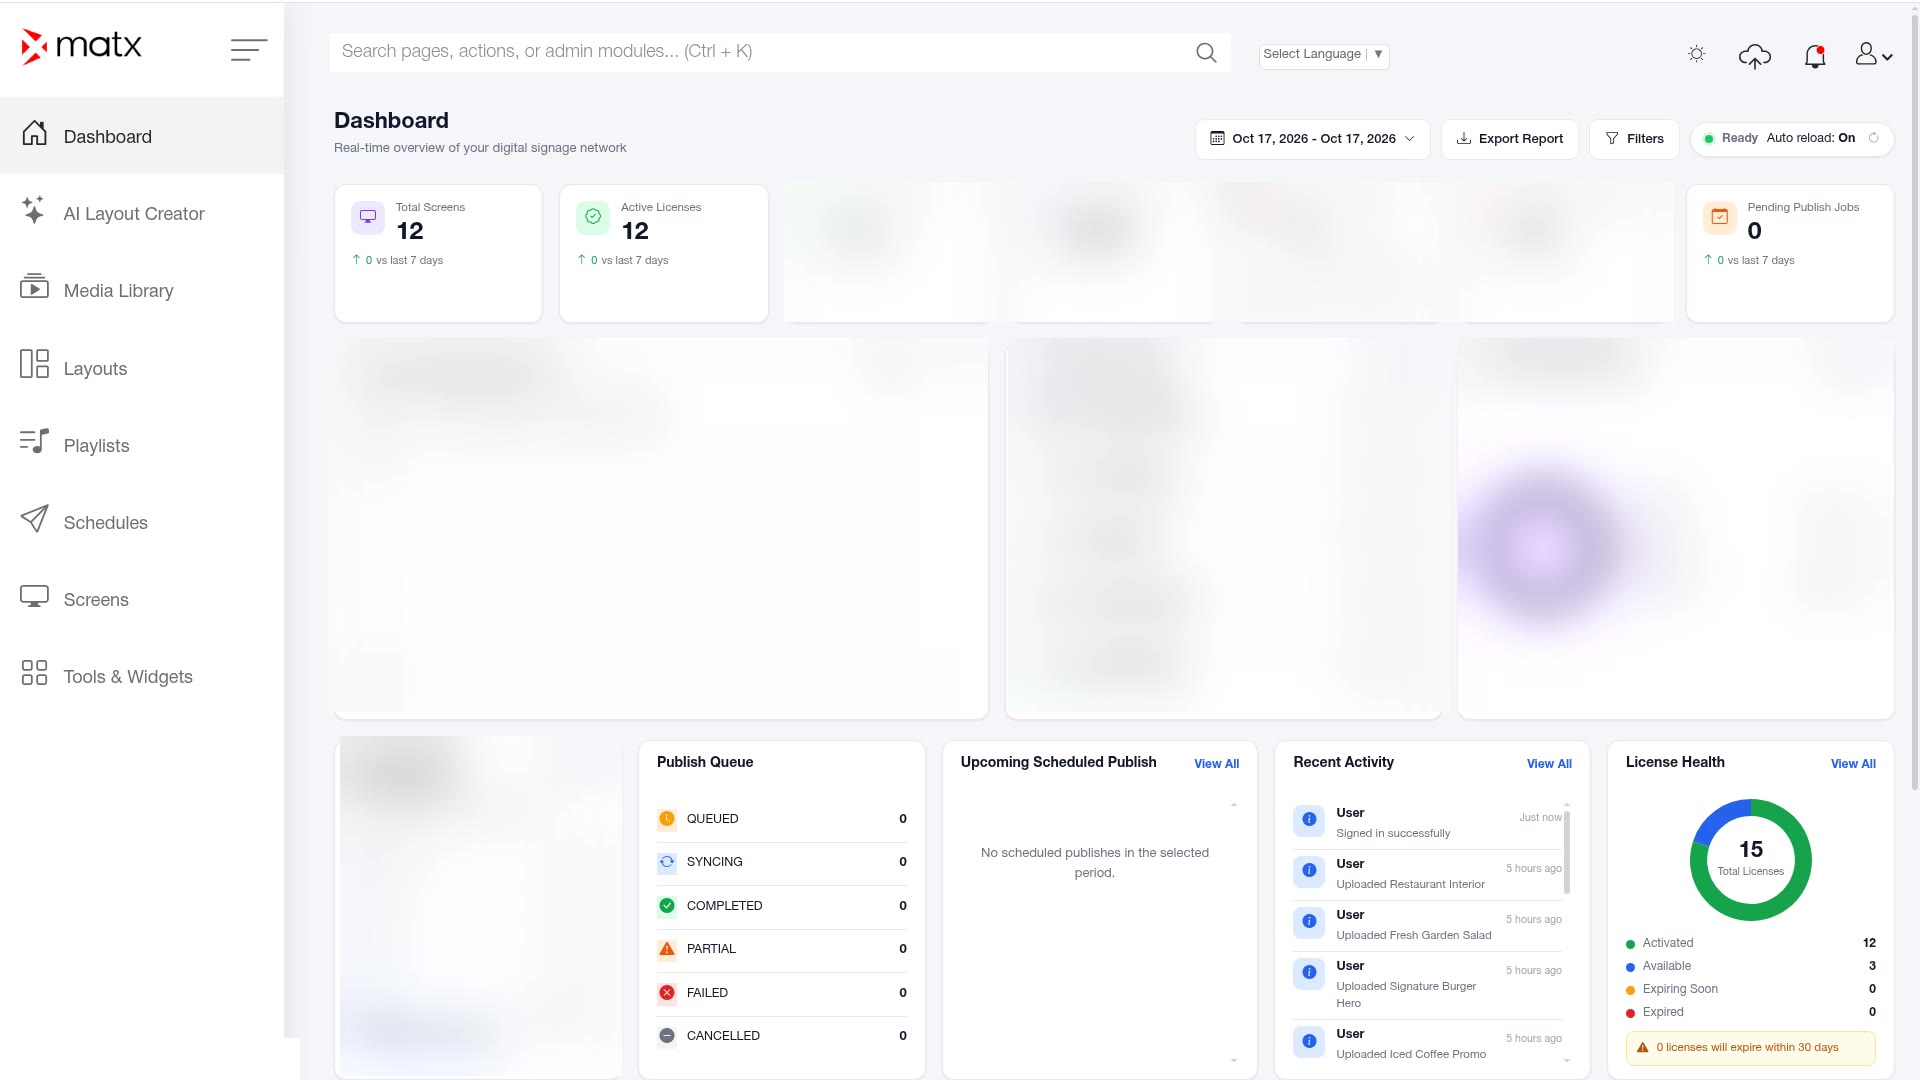 Dashboard, summary cards
9.2 Health charts, Publish Queue, Recent Activity and System Events
- Health charts show device connectivity and health over time.
- Publish Queue shows publishing jobs and their progress.
- Recent Activity shows the latest actions in the portal.
- System Events shows events reported by the system.
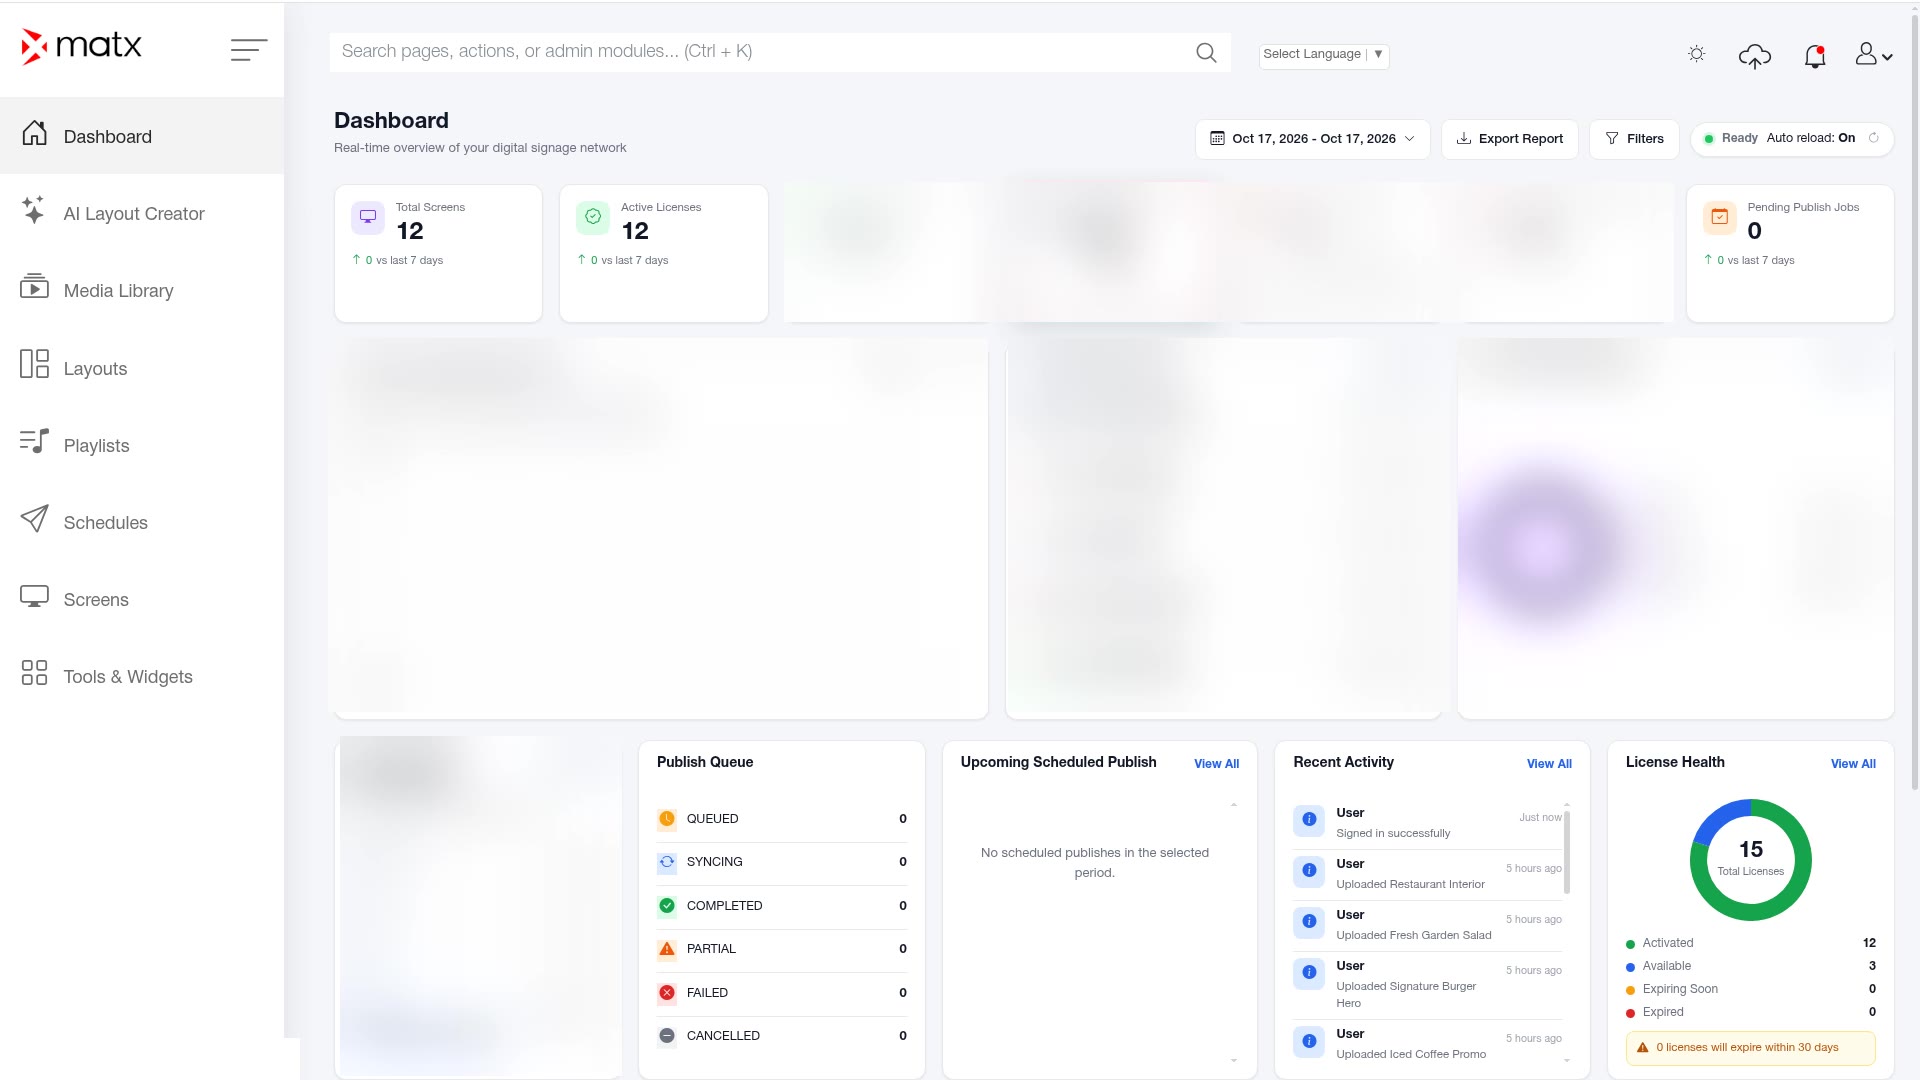 Dashboard, health charts and Publish Queue
9.3 Filter by date range and report on activity
Use the date range picker on the Dashboard to choose the period you want to review.
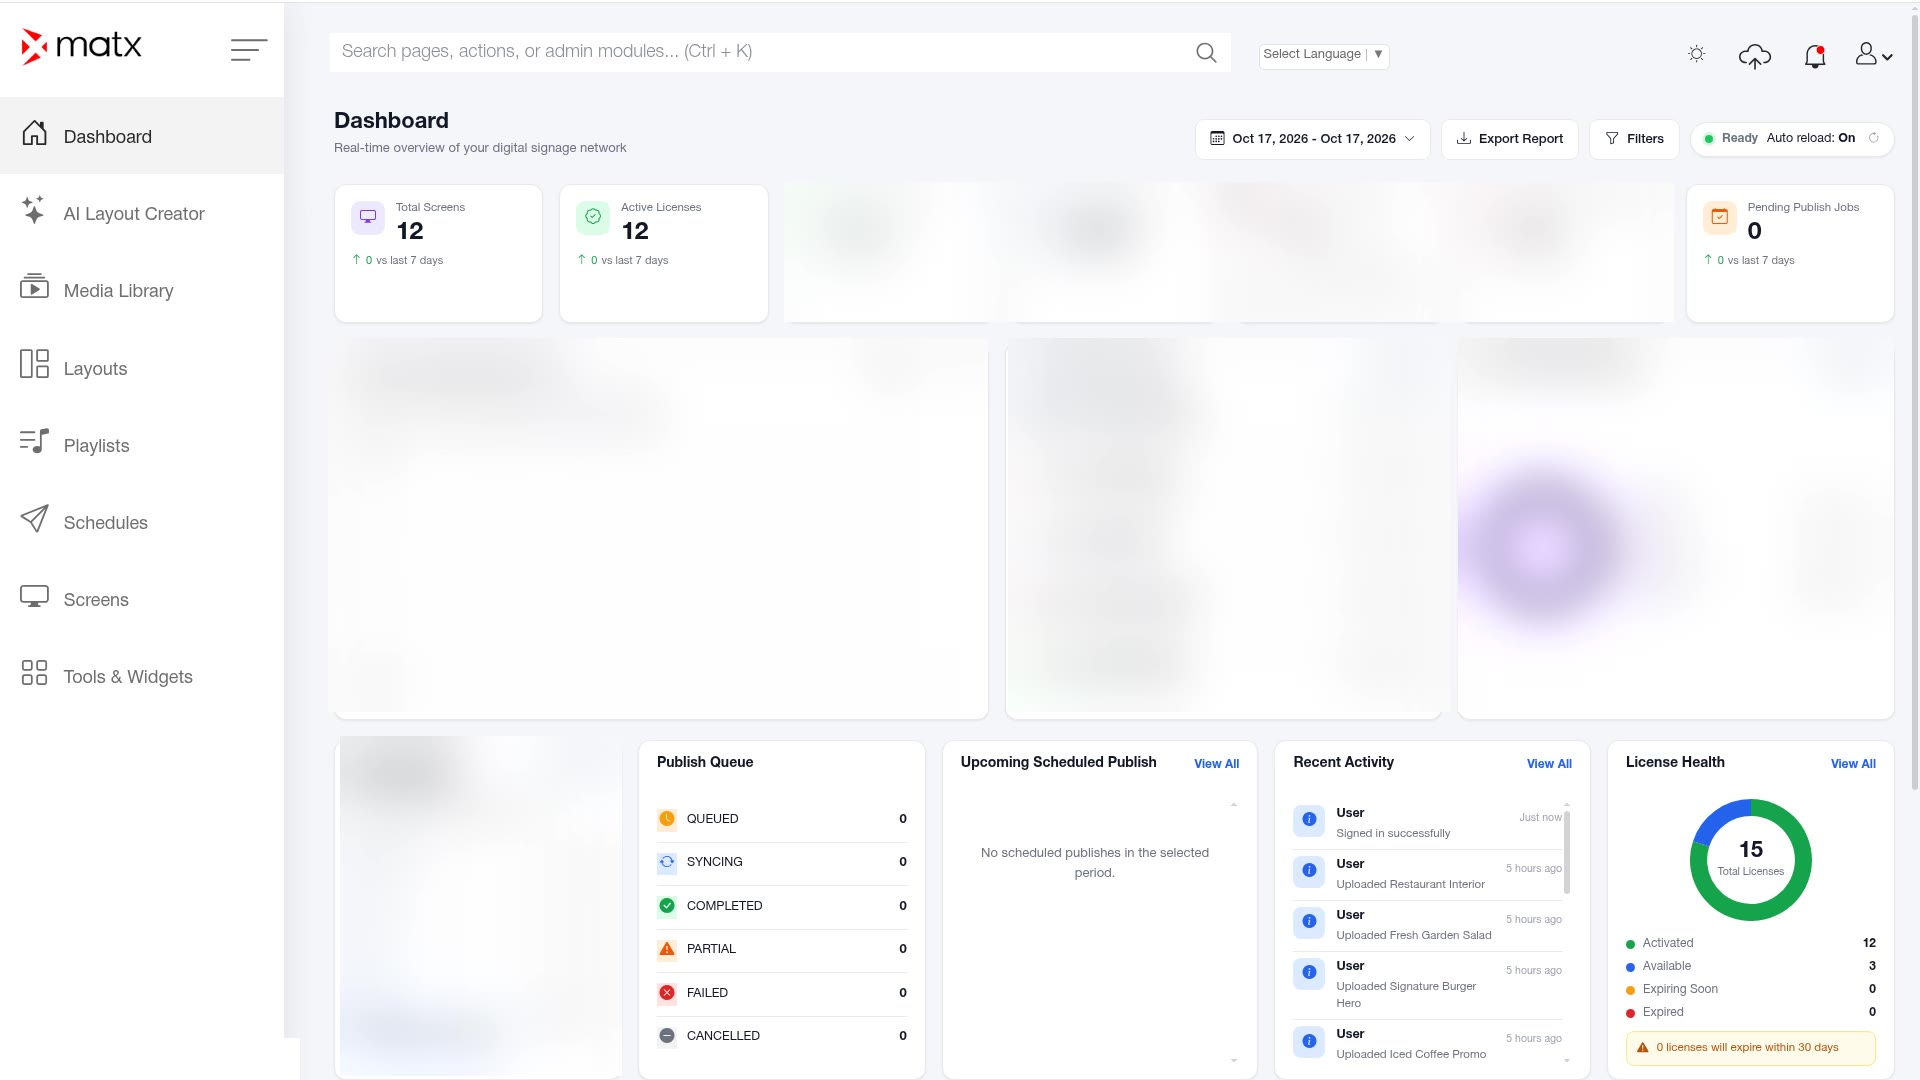 Dashboard, date range picker
Review the cards and charts for that period.
For a record of who changed what, open Audit Logs from the profile menu.
For additional insights, open Analytics from the profile menu.
 Digital Signage